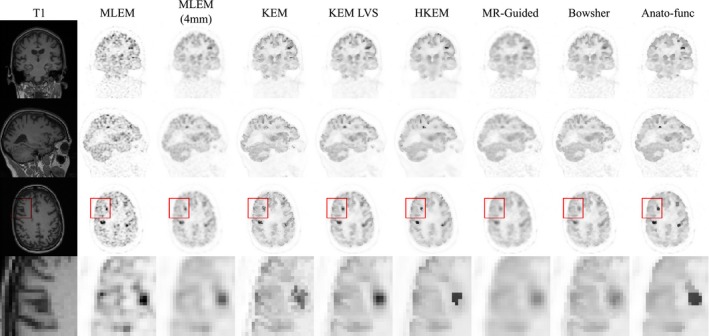
Figure 13.

The reconstructed images are shown for each of the reconstruction methods investigated, applied to the 10% count level‐augmented real dataset. A zoomed in transverse region is shown along the bottom row. All magnetic resonance‐informed methods are shown at approximately fixed white matter standard deviation, as indicated by arrows in, Fig. 12. Maximum likelihood expectation maximization is shown with postreconstruction smoothing (FWHM 4 mm). [Color figure can be viewed at http://wileyonlinelibrary.com]
