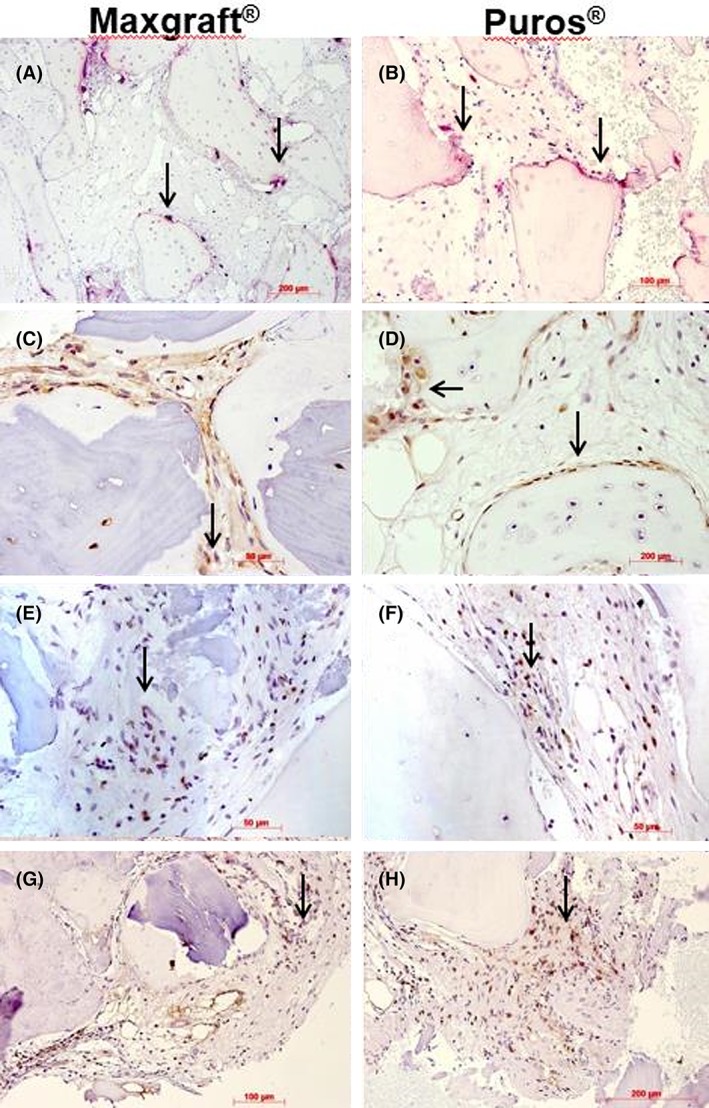
Figure 3.

Histochemistry and immunohistochemistry I. Representative photomicrographs of biopsies; Maxgraft shown in (A), (C), (E), and (G), Puros in (B), (D), (F) and (H); osteoclasts on bone surfaces (arrows), TRAP staining, original magnification ×10 (A, B); alkaline phosphatase immunohistochemistry, arrows indicate immunoreactive osteoblasts; DAB, ×40; CD4 immunohistochemistry, arrows indicate very few immunoreactive cells, DAB, ×40 (E, F); CD3 immunohistochemistry, arrows indicate few immunoreactive cells, DAB ×20, ×40 (H)
