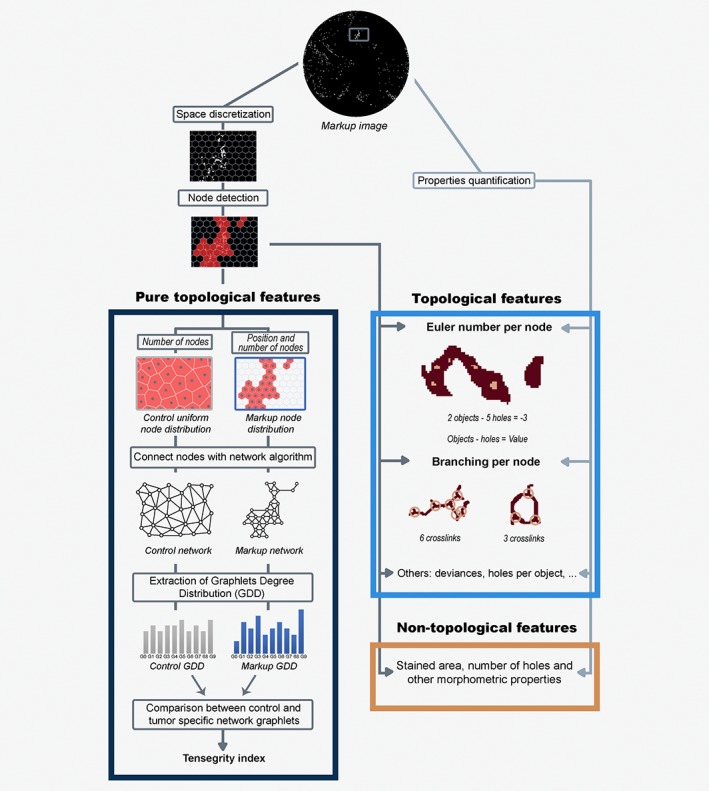
Figure 2.

Pipeline overview of how the features are extracted. The process starts with the initial markup image, which in this example corresponds to territorial VN. A region of interest (ROI) from the initial image was selected (in dark gray) to show the space discretization and further operations. Below, the nodes (in red) are identified when a hexagon has VN inside. This information is used to obtain the pure topological features (dark blue, left side), a subset of the topological characteristics. In particular, the number of nodes is used to create the control with a uniform node distribution, while the position and number of nodes are utilized to gain the markup node distribution. Thereafter, each distribution of nodes is connected using a network algorithm (sorting, iteration or minimum spanning tree methods) and the graphlets degree distribution (GDD) is computed for both control and markup networks. To obtain the tensegrity index, the distance between the control GDD and the markup GDD is calculated. For topological characteristics (blue, right side), excluding the pure topological ones, two sources of information are used: the hexagonal grid and detected nodes (arrows in darker gray), and properties quantification performed directly on the markup image (lighter gray arrows). Two topological features are highlighted: Euler number per node, where the Euler number is calculated by subtracting the two objects (in brown) against the five holes within them (in light brown) resulting in a Euler number of minus three; and Branches per node in which the crosslinks (circles in light brown) from territorial VN shapes (in brown) were detected. Likewise, the nontopological features (orange, bottom right) use information extracted directly from the markup image and from the space discretization.
