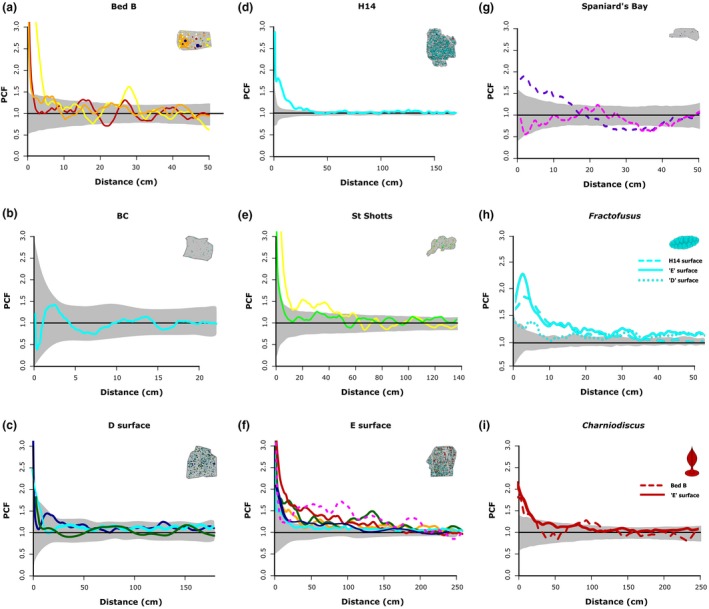
Figure 2.

Univariate PCF analyses for the seven Ediacaran fossil surfaces (a–g) and for Fractofusus and Charniodiscus from multiple surfaces (h–i). (a) Bed B, Charnwood Forest, (b) Bristy Cove/X‐Ray surface, (c) ‘D’ surface, (d) H14/Johnson surface (e) St. Shott’s surface, (f) ‘E’ surface, and (g) Spaniard’s Bay surface. The univariate PCFs of (h) Fractofusus and (i) Charniodiscus demonstrating the consistency of their respective spatial distributions between localities. Where the best‐fit model for the distribution represents a niche process (Table 2), it is drawn as a dashed line. Models indicating neutral processes are drawn as solid lines. Black line represents the random model. The grey area is the simulation envelope for 999 Monte Carlo simulations of complete spatial randomness. The x‐axis is the inter‐point distance between organisms in metres. On the y‐axis PCF = 1 indicates complete spatial randomness (CSR), < 1 indicates segregation, and > 1 indicates aggregation. Different colours indicate different taxa as follows: Thectardis navy; Fractofusus light blue; Charnia bright yellow; Charniodiscus dark red; Aspidella light green; Bradgatia dark green; ‘Feather Duster’, light orange; Primocandelabrum dark orange; Trepassia dark purple; Beothukis bright pink; Pectinifrons dark blue; ‘Brushes’ brown; Avalofractus dark blue (Spaniard’s Bay surface only); Hylaecullulus light yellow. This figure shows that neutral processes (solid lines) dominated these Avalonian communities, and that Fractofusus and Charniodiscus show the same distributions across multiple surfaces.
