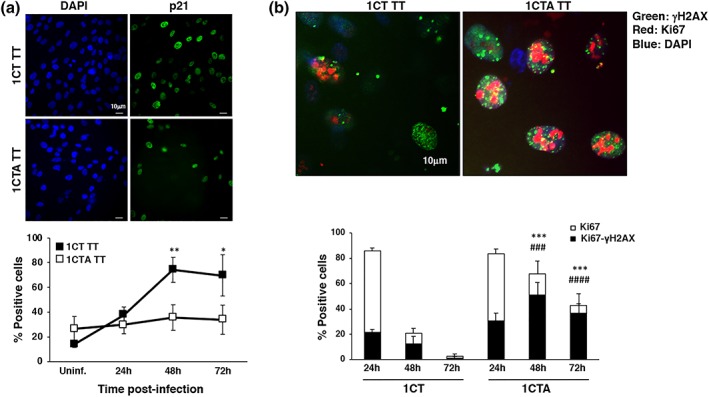
Figure 5.

APC deficient cells proliferate in spite of the presence of DNA damage. 1CT and 1CTA cells grown in 2D culture were infected with the MC1 TT strain as described in Figure 1. (a) Upregulation of p21 expression was assessed by immunofluorescence analysis. Upper panel: representative fluorescence micrographs; lower panel: quantification of the positive cells. Mean ± SEM of three to four independent experiments. Statistical analysis comparing 1CT and 1CTA for each time point was performed using the Student t test: *p < .05; **p < .01. (b) Induction of proliferation status and DNA damage was assessed by immunofluorescence analysis, using antibodies specific for Ki67 and γH2AX, respectively. Upper panel: representative micrograph showing cells double positive for the proliferation (Ki67, red) and DNA damage (γH2AX, green) markers. Nuclei were counterstained with DAPI (blue). Lower panel: quantification of 1CT and 1CTA cells infected with the MC1 TT strain positive for Ki67 (white bar) and double positive for both Ki67 and γH2AX (black bar). Mean ± SEM of three to four independent experiments. Statistical analysis was performed using the Student t test. *,# p < .05; **,## p < 0.01; ***,### p < .001; ****,#### p < .0001. *comparison Ki67 positive cells, #comparison Ki67‐γH2AX double‐positive cells
