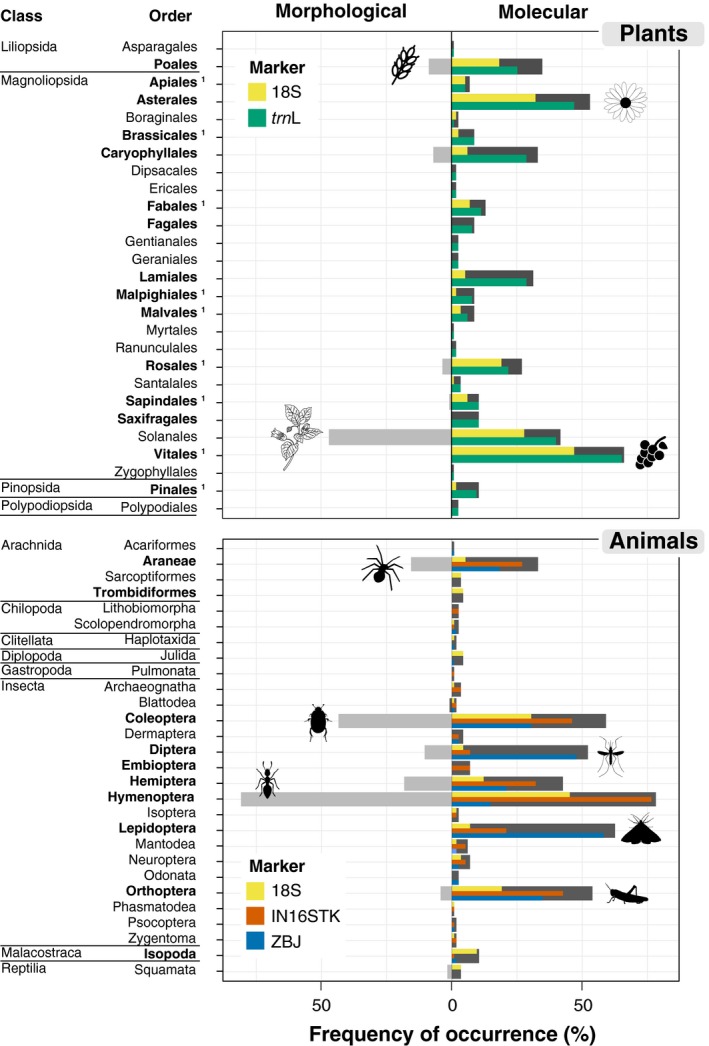
Figure 2.

Frequencies of occurrence of each order of plants and animals in the diet of Black Wheatears obtained through morphological and molecular analysis (multi‐marker, dark grey bar, and for each set of primers). The orders highlighted in bold indicate significant differences at univariate tests of Multivariate Generalized Linear Models. 1indicates orders that only showed significant differences among the molecular markers and morphological identification [Colour figure can be viewed at http://wileyonlinelibrary.com]
