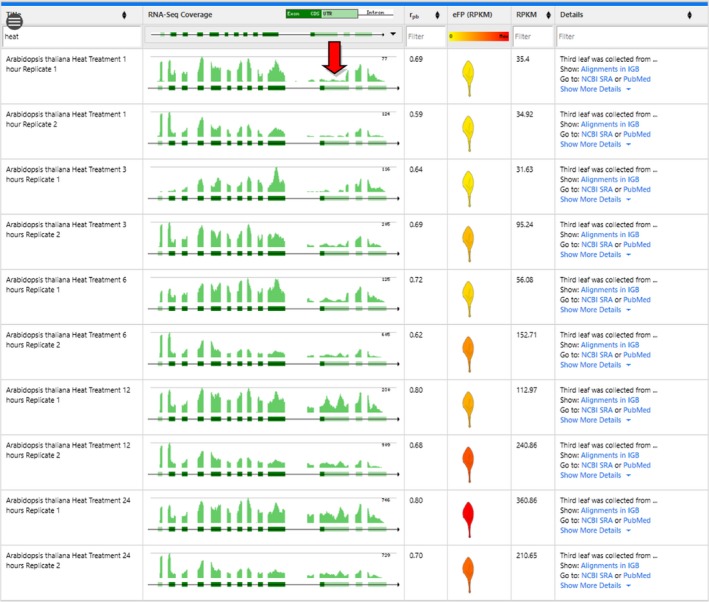
Figure 4.

Change in splice variant abundance for SR34 (At1g02840.2) following a heat treatment time course from Klepikova et al. (2016).
The red arrow indicates the retained intron of splice variant 2. Earlier timepoints are at the top of the table, while later timepoints are at the bottom of the table.
