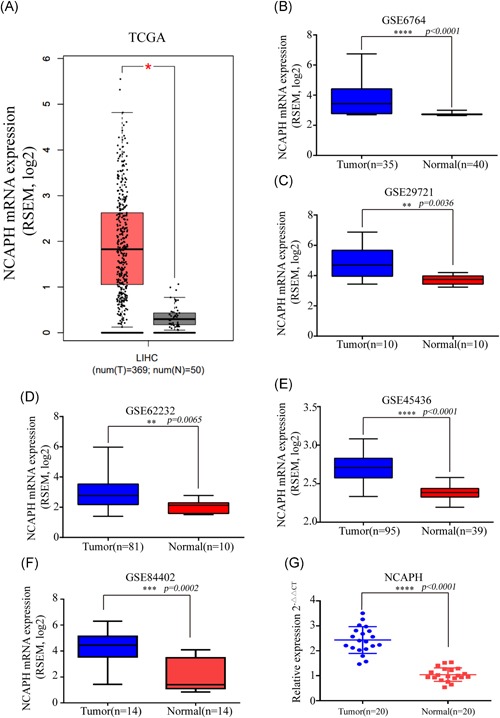
Figure 1.

NCAPH is upregulated in HCC tissues. NCAPH was highly expressed in HCC tissues compared with normal liver tissues in the TCGA dataset (A; tumor, n = 369; normal, n = 50, P < .05) and GEO (B‐F; GSE6764, tumor, n = 35; normal, n = 40, P < .0001; GSE29721, tumor, n = 10; normal, n = 10, P = .0036; GSE45436, tumor, n = 95; normal, n = 39, P < .0001; GSE62232, tumor, n = 81; normal, n = 10, P = .0065; GSE84402, tumor, n = 14; normal, n = 14, P = .0002). NCAPH expression was upregulated in HCC upon comparison of 20 pairs of HCC tissues and ANLTs (P < .0001) (G). *Statistical significance. The Student t test was used to compare the differences. HCC, hepatocellular carcinoma; NCAPH, non‐SMC condensin I complex subunit H [Color figure can be viewed at wileyonlinelibrary.com]
