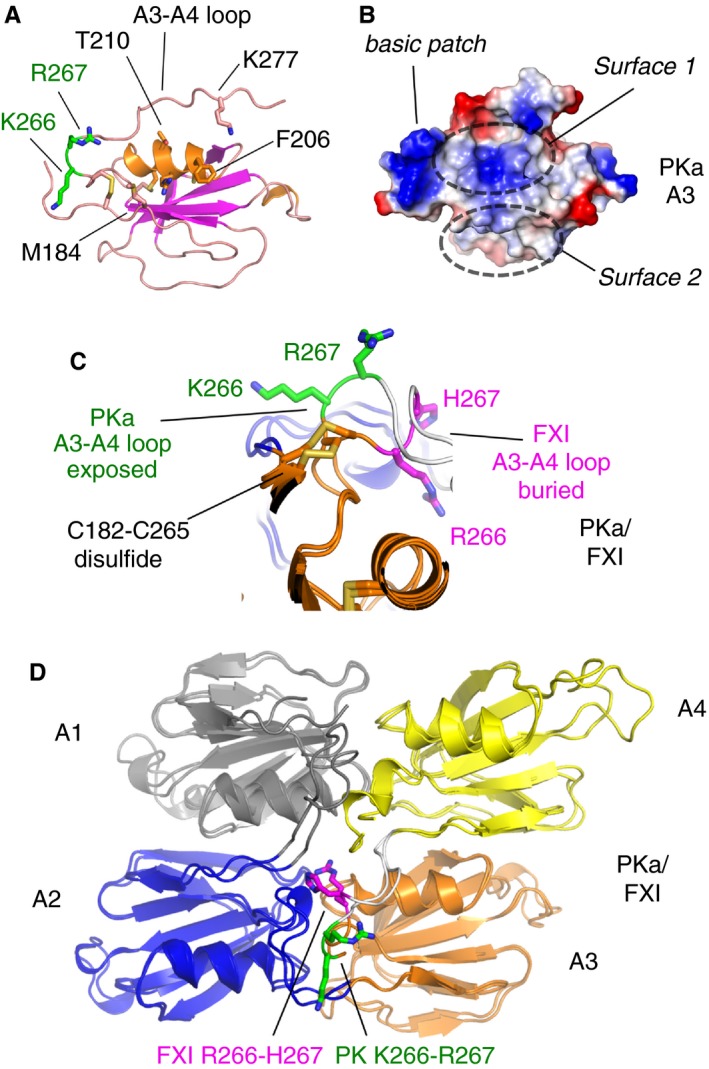
Figure 3.

Comparison of the PKa and FXI apple 3 domains. (A) A cartoon diagram of the PKa apple 3 domain structure is shown with key residues highlighted as sticks. (B) Charged representation of the apple 3 domain upper surfaces. A pocket formed by the loop connecting to the apple 4 domain is indicated by a dashed elliptical line labeled as surface 1. A second flat surface 2 is defined by residues from the N‐terminal region of the apple 3 domain. (C) Cartoon diagram showing a superposition of the loop structure connecting the apple 3 and 4 domains from PKa with the equivalent FXI structure. Residues Lys266 and Arg267 (green) from PKa are raised and become surface exposed compared to the equivalent residues His267 and Arg266 in FXI (purple), which are buried. Disulfides are in yellow. (D) Cartoon diagram showing the PKa and FXI apple 1 to 4 domains superposed and colored as in Fig. 1. Key residues showing a major conformational difference in the apple 3 to 4 domain connecting loop are shown as sticks. FXI, factor XI; PKa, plasma kallikrein.
