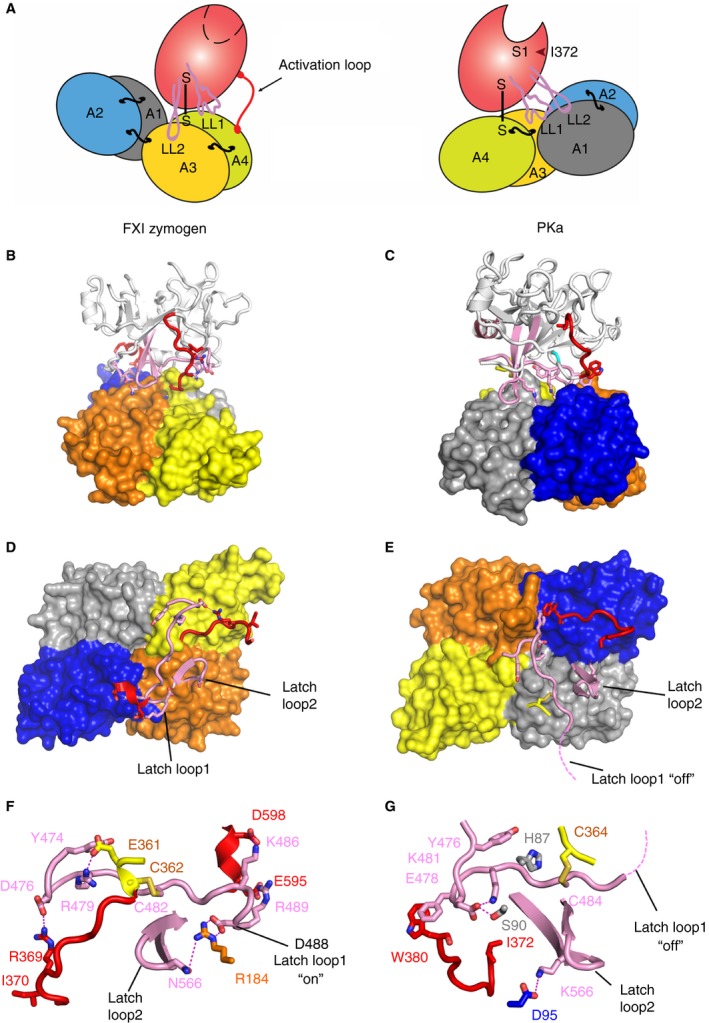
Figure 4.

Comparison of full‐length PKa and FXI zymogen structures. (A) A schematic diagram of the domain organization observed in the FXI zymogen monomer (left) with two latch loops (LL1, LL2) located above the apple 3 domain compared to the PKa structure (right) with the latch loop 1 interacting with the apple 1 domain. (B) Cartoon diagram of the FXI zymogen crystal structure protease domain above a surface representation of the apple domains and (C) PKa with an equivalent orientation of the protease domain and color scheme to illustrate the large 180° relative rotation of the apple domains. The latch loops are pink and the activation loop red. (D) The FXI apple domains alone are shown as a surface representation with latch loop1 and loop2 (pink) and the activation loop (red) shown as cartoon. (E) The same figure of PKa shows the positions of the three loops at the interface between the protease domain illustrating 180°‐rotation compared to FXI with the latch removed and partially disordered (dotted line). Close‐up views of the latch loops “on” in FXI are shown in (F) with an equivalent latch loop orientation shown for PKa in (G). Key residues are highlighted as sticks including the Asp488 from latch loop 1, which covers the substrate binding pocket in the FXI zymogen. FXI, factor XI; PKa, plasma kallikrein.
