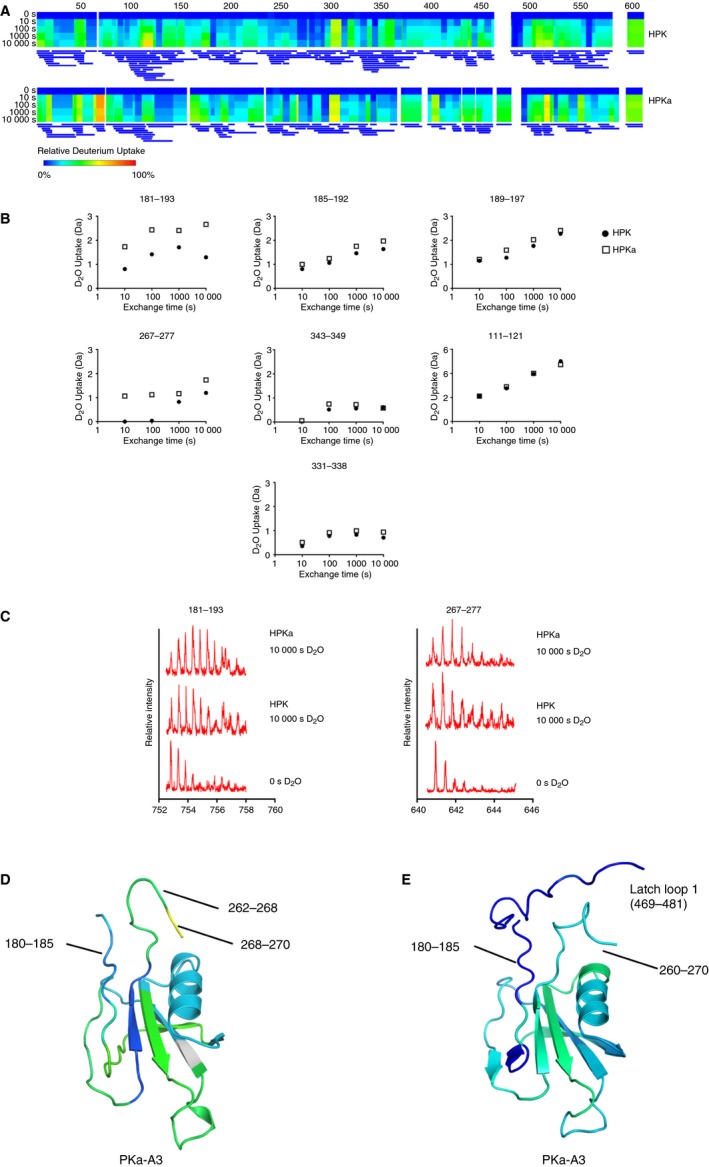
Figure 5.

Hydrogen‐deuterium exchange (HDX) characterization of PK and PKa. (A) Heatmaps showing relative fractional uptake over exposure time via Dynamx Software. For PK, 150 peptide fragments were assigned, achieving 94.9% sequence coverage and a redundancy of 4.99. For PKa, 113 peptide fragments were assigned, achieving 94.7% sequence coverage and a redundancy of 3.14. (B) Deuterium uptake of specific peptides in PK and PKa. Deuterium uptake for peptides shared between the data sets was plotted over time of D2O exposure. Structural differences at the rotation site are consistent with HDX data presented, while structural consistencies remain largely the same and are supported in the HDX data. (C) Mass spectra of highlighted peptides that show differences in the PK and PKa apple 3 domain from 0 to 10 000 s D2O exposure. (D) Cartoon diagram of the PKa apple 3 domain crystal structure showing greater deuterium exchange for residues in the region of residues 180 to 185 (light blue) and 262 to 270 (green/yellow colored based on the heatmap) compared to (E) the PK zymogen apple 3 domain model with reduced deuterium exchange for the equivalent regions (dark blue). FXI, factor XI; PKa, plasma kallikrein.
