Figure 4.

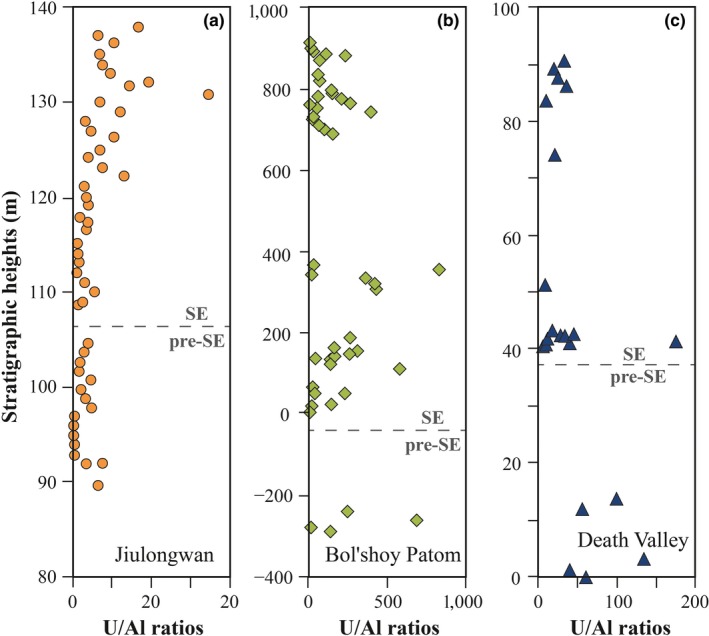
Stratigraphic variations in U/Al ratios from the Jiulongwan section (a), the Bol'shoy Patom section (b), and the Death Valley section (c) [Colour figure can be viewed at http://wileyonlinelibrary.com]

Stratigraphic variations in U/Al ratios from the Jiulongwan section (a), the Bol'shoy Patom section (b), and the Death Valley section (c) [Colour figure can be viewed at http://wileyonlinelibrary.com]