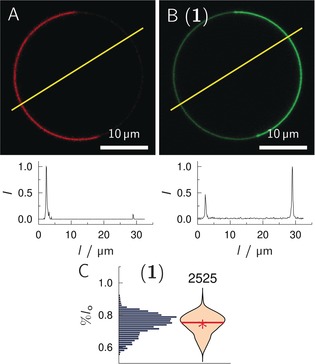
Figure 2.

Confocal images of a phase‐separated GUV composed of DOPC/SM‐porc/Chol/1/Dy731‐DOPE (39/39/20/1/1). A) Dy731‐DOPE fluorescence (red). B) 1 fluorescence (green). The yellow lines indicate where the fluorescence intensity profiles (bottom images) were obtained. From the intensity profiles %l o=68.2 % was calculated for 1. C) Histogram and corresponding violin plot obtained from 60 GUVs (number of line profiles atop) with the composition as in (A/B). The red solid line indicates the median value, the red star the mean value.
