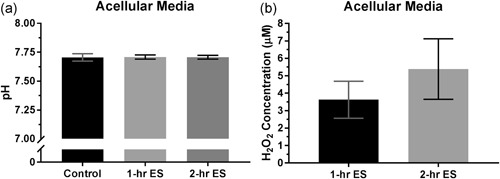
Figure 2.

(a) pH and (b) hydrogen peroxide (H2O2) concentration of the culture media after 1 and 2 hr of electrical stimulation (ES). Error bars represent standard deviation (n = 6). Data were statistically analyzed by one‐way analysis of variance with Tukey's multiple comparisons test for pH and unpaired two‐tailed Student's t test for H2O2 concentration
