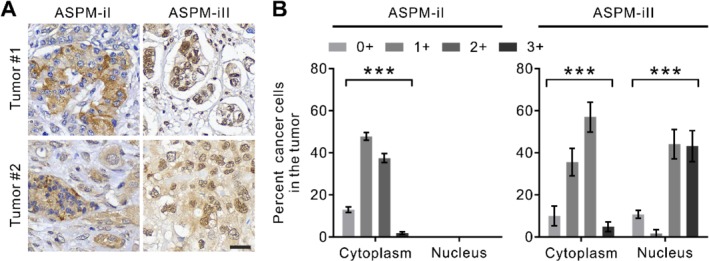
Figure 2.

The differential expression patterns of ASPM‐iI and ASPM‐iII in PDAC tissues. (A) IHC staining of ASPM‐iI and ASPM‐iII in representative human PDAC tissues (tumor #1 and tumor #2; 200× magnification). Scale bar = 30 μm. (B) Bar charts showing the distribution of the single‐cell staining intensities (0+ to 3+) of ASPM‐iI and ASPM‐iII in human PDAC tissues. Mean ± SEM (n = 50). ***p < 0.001.
