Figure 6.

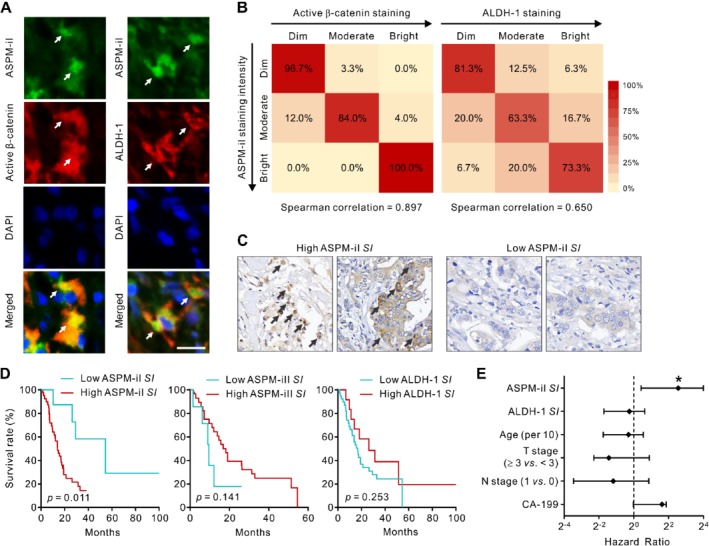
ASPM‐iI co‐localizes with active β‐catenin and ALDH‐1 and is prognostically significant in PDAC. (A) Representative IF images showing the co‐localization (yellow; arrows) of ASPM‐iI (green) with active β‐catenin (red, left panels) or ALDH‐1 (red, right panels) in human PDAC tissues. Nuclei were counterstained with DAPI (blue). Scale bar = 25 μm. (B) Heatmaps illustrating the correlation of the staining intensity of ASPM‐iI with that of active β‐catenin or ALDH‐1 in PDAC tissues (n = 50). (C) Representative IHC images (400× original magnification) showing the tumors with high or low ASPM‐iI SI. Arrows indicate tumor cells with a high (≥ 2+) staining intensity of ASPM‐iI. (D) The staining pattern of ASPM‐iI is prognostically significant in PDAC. Kaplan–Meier survival curve comparing overall survival of the patients with resected PDAC (n = 50) stratified according to the staining index (SI; the percentage of tumor cells expressing a moderate‐to‐high staining intensity) of ASPM‐iI, ASPM‐iII, or ALDH‐1 within the tumors. The cut‐off value of each SI was determined using the concordance index. (E) Forest plots showing hazard ratios (with 95% confidence limits) of death according to the SI of ASPM‐iI or ALDH‐1 or clinico‐pathological criteria in a Cox proportional‐hazards analysis. *p < 0.05.
