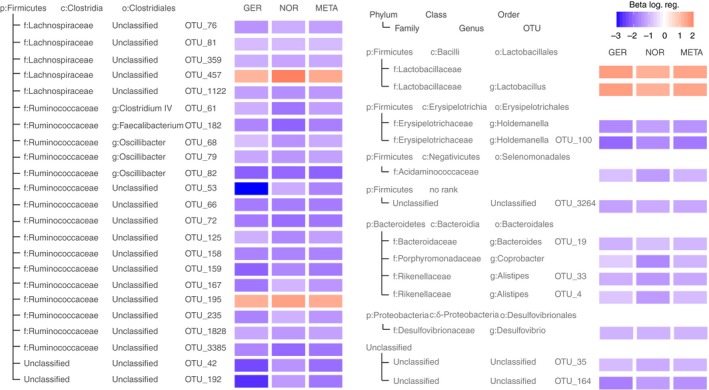
Figure 3.

Robust results of the logistic regression within cohorts and the meta‐analysis testing for differential prevalence of taxonomic groups in PSC patients and healthy controls. Only taxa with P < 0.05 in each cohort, Q META < 0.05 and concordant effect direction are shown. Colour saturation expresses the effect size (Beta) of the association. Beta‐values larger than zero (red boxes) represent a higher prevalence in PSC patients, taxa with values less than zero (blue) are less prevalent in PSC patients. Details on the model coefficients and the resulting P‐values in the cohorts and the meta‐analysis can be found in Table S4. p: phylum, c: class, o: order, f: family, g: genus
