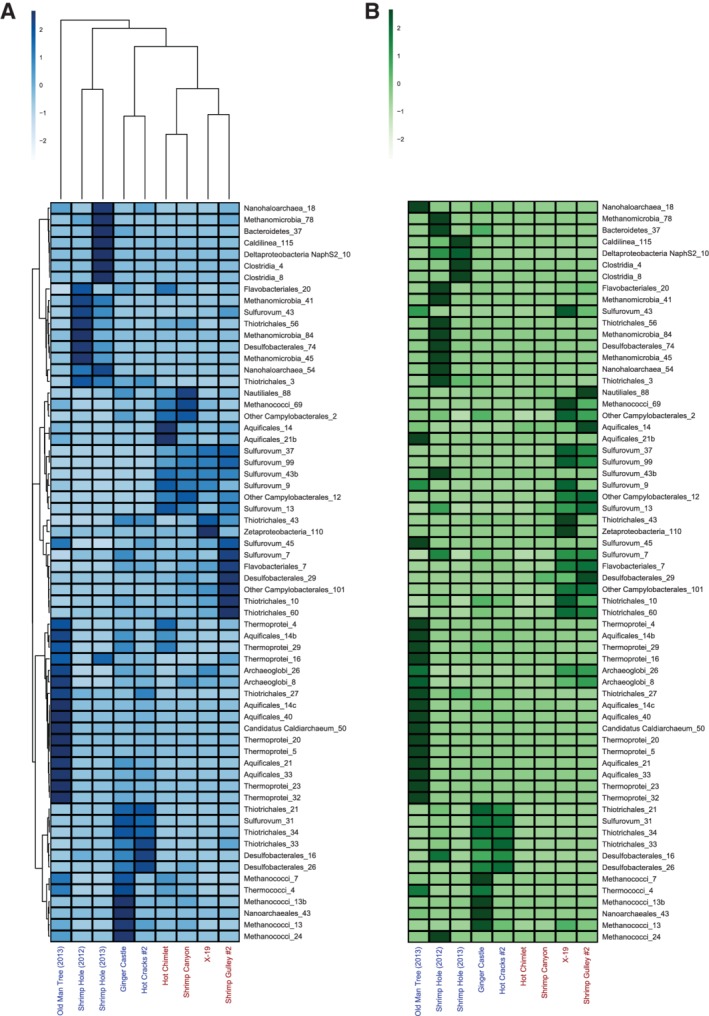
Figure 3.

Normalized abundance of metagenomic and metatranscriptomic read mapping for MAGs across samples. For both heatmaps, the x‐axis shows samples from Piccard (red) and Von Damm (blue).
A. Heatmap of MAG transcript abundance across samples. MAG metatranscriptomic coverage values were normalized using the number of metranscriptomic reads in each sample.
B. Heatmap of MAG metagenomic read abundance across samples. MAG metagenomic coverage values were normalized using the number of metagenomic reads in each sample. For both heatmaps: x‐axis shows samples at Piccard and Von Damm; y‐axis shows high‐quality MAGs. A z‐score transformation was applied to each row; the legend indicates the z‐score for a cell relative to the mean for all values in that row. A MAG has an elevated z‐score if its coverage at that site is higher than the average for the MAG across all sites. Dendrograms in part (A) indicate hierarchical clustering for MAGs and samples based on z‐scored values according to the metatranscriptomic coverage. The samples and MAGs in part (B) were ordered to match the clustering order shown in part (A).
