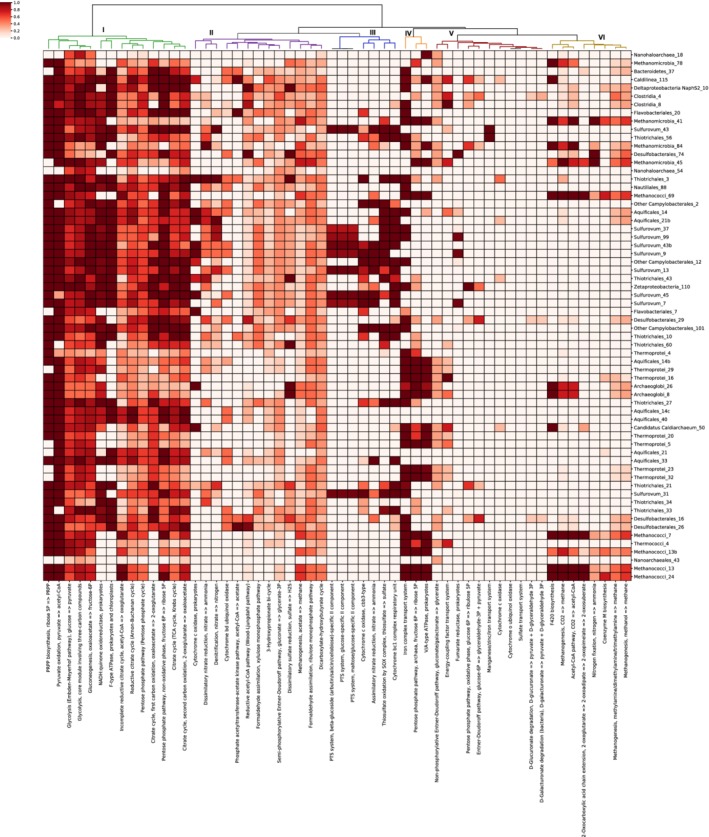
Figure 4.

Metabolic potential of MAGs for key metabolic modules. The x‐axis shows metabolic pathways selected from the KEGG modules database; the y‐axis shows high‐quality MAGs. The legend shows the module completion score for each MAG in each module. Module completion was based on the presence or absence of a given KEGG annotation in all the contigs of a particular MAG. Dendrograms show hierarchical clustering of metabolic pathways based on MCSs. MAGs are ordered to match the metatranscriptomic coverage clustering order shown in Fig. 3. The colouring of the branches represents the six clusters discussed in the text.
