Figure 2.

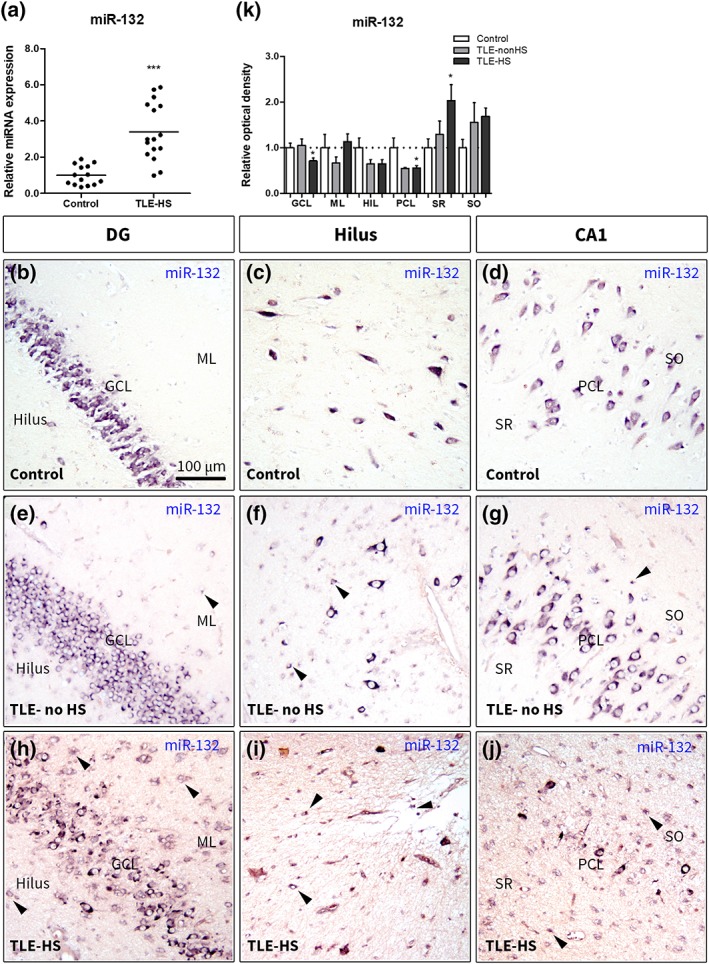
Expression of miR‐132 in the human hippocampus. (a)—Taqman RT‐qPCR showed a 3.4‐fold higher (p < .001) miR‐132 expression in the hippocampus of patients with TLE‐HS; (b–j)—in situ hybridization for miR‐132 in the hippocampus of TLE without HS (e–g) and TLE with HS (h–j) patients compared to autoptic control (b–d); mostly neuronal expression of miR‐132 was observed in the DG (b), hilus (c), and CA1 regions of control hippocampus. Higher expression was observed in cells with glial morphology in the DG ML (e, here and further indicated by black arrowheads), hilus (f) and CA1 (g) which was most prominent in the DG ML of TLE‐HS (h); hilus (i) and CA1 (j) and was associated with GCL dispersion and severe neuronal loss in the hilus and CA1 PCL; (k)—OD analysis showed a higher expression in CA1 SR (p < .05) and a lower expression in the GCL and PCL (both p < .05) of the TLE‐HS hippocampus relative to control; DG, dentate gyrus; GCL, granule cell layer; Hil, hilus; ML, molecular layer of the dentate gyrus; PCL, pyramidal cell layer; SO, stratum oriens; SR, stratum radiatum; scale bar 100 μm; Mann–Whitney U test *p < .05, ***p < .001 [Color figure can be viewed at https://wileyonlinelibrary.com]
