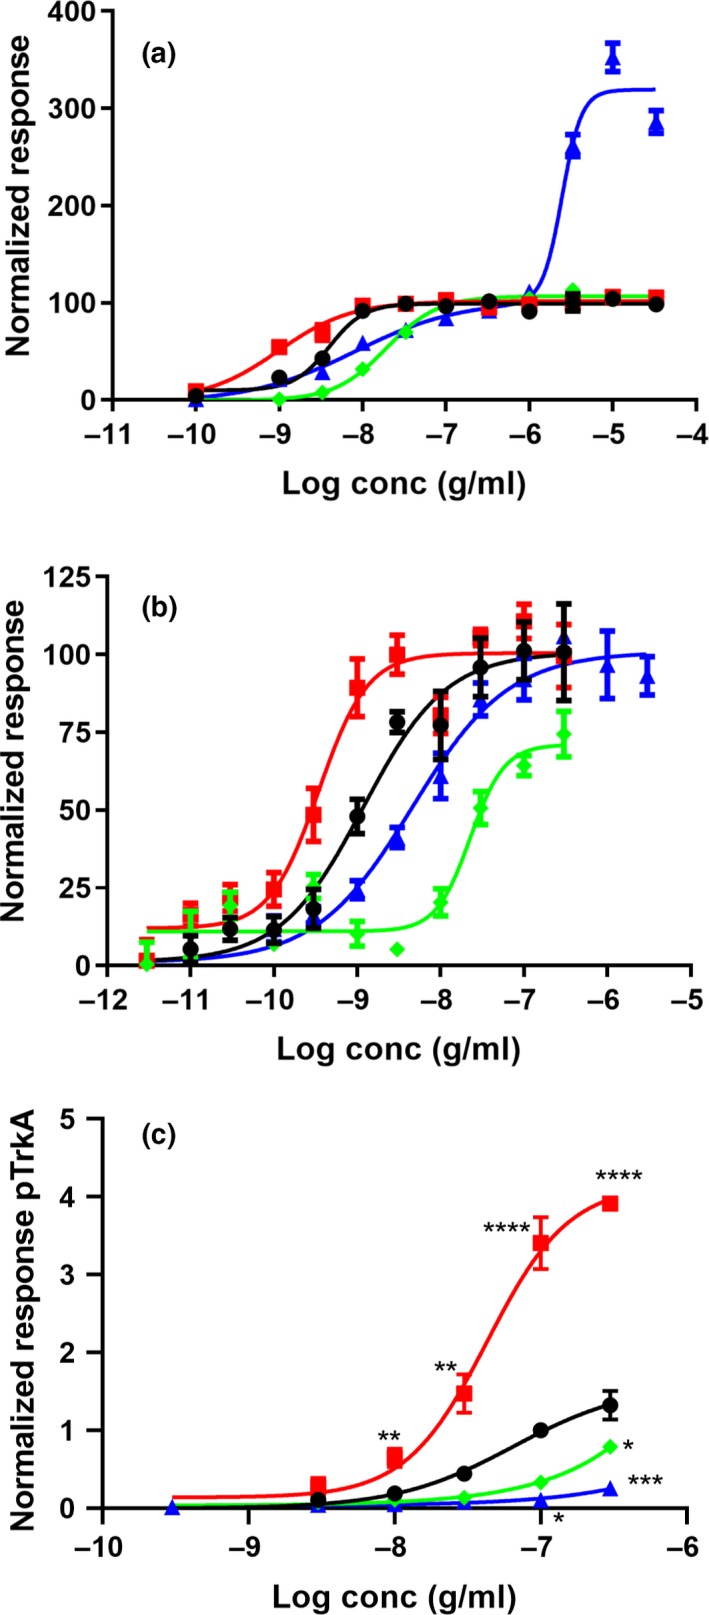
Figure 6.

Activation of TrkA in U2OS‐TrkA/p75‐SHC1 cells. Total chemiluminescent signal from all wavelengths was measured using reagents and recombinant cells from DiscoverX. The luminescent signal is proportional to the amount of interactions between TrkA and SHC1 or PLCγ1 present in each well. Normalized response of the interaction between TrkA and SHC1 in U2OS‐TrkA/p75‐SHC1 cells (a), or between TrkA and PLCγ1 in U2OS‐TrkA‐PLCγ1 cells (b) after 3 hr of treatment. Five (a) or four (b) independent biological repeats with four technical replicates were conducted. (c) ELISA was used to quantify direct phosphorylation of TrkA from three independent biological repeats after normalization to 100 ng/ml wild‐type NGF. Results are mean ± SEM, significant alterations compared with wild‐type NGF were found for 100 ng/ml and 300 ng/ml R100E (****p < .0001), 30 ng/ml R100E (**p = .0016), 10 ng/ml R100E (**p = .0031), 300 ng/ml W99A (*p = .0363), 100 ng/ml K95A/Q96A (*p = .0185) and 300 ng/ml K95A/Q96A (***p = .0006). Wild‐type NGF (black circles ●), NGF‐R100E (red squares  ), NGF‐W99A (green diamonds
  ) or NGF‐K95A/Q96A (blue triangles
  )
)
