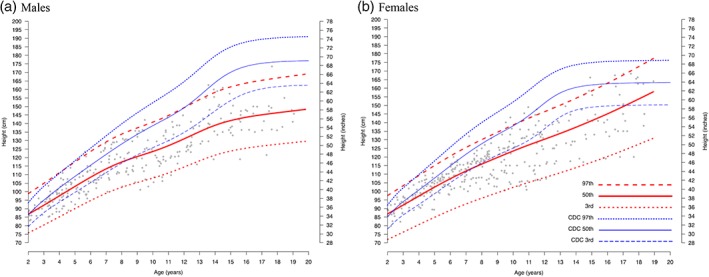
Figure 2.

Estimated height curves for untreated individuals with attenuated MPS I disease 2–20 years old with CDC/WHO standard curves overlaid on a scatter plot of MPS I registry data. LMS estimated curves (red) and reference curves (blue) for height by age are shown overlaid on MPS I registry data (gray scatter) for those with attenuated MPS I. (a): observations from 87 males with 298 records; (b): observations from 104 females with 342 records. Median MPS I estimated length/height is shown as solid red lines, and the 97th and 3rd percentiles are shown as red hatched lines. CDC median and 97th and 3rd percentiles curves are shown in blue. CDC, Centers for Disease Control and Prevention; MPS I, Mucopolysaccharidosis Type I; LMS, Lambda Mu Sigma; WHO, World Health Organization
