
Figure 4.
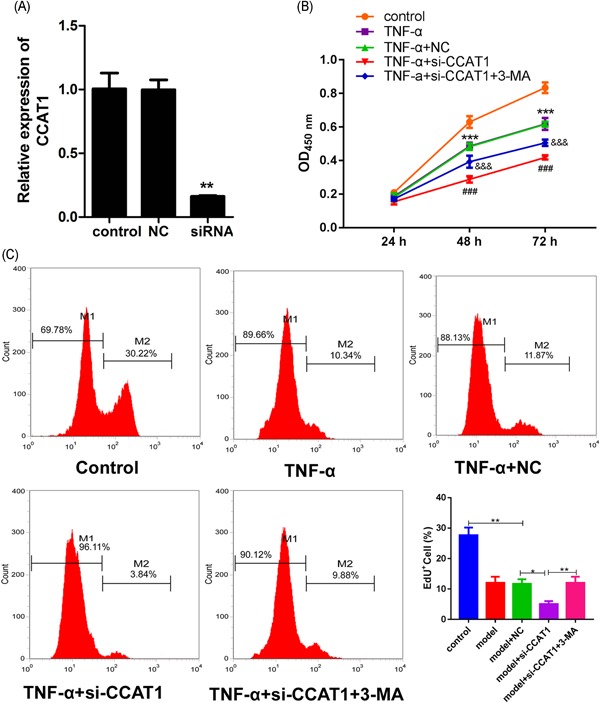
Effects of CCAT1 knockdown on podocyte viability
The siRNA against CCAT1 (si‐CCAT1) or the negative control (NC) was transfected into the podocytes. Subsequently, the qRT‐PCR assay was performed to examine the expression of CCAT1 in the transfected and the parent cells (A). **P < .01, compared with the NC group. The parent and transfected cells were treated with TNF‐α for 24 hours, 48 hours, or 72 hours alone, or in combination with 3‐MA. After treatments, the cell viabilities were determined with the CCK‐8 assay (B), ***P < .001, compared with the control group; ### P < .001, compared with the group of TNF‐α + NC; &&& P < .001, compared with TNF‐a + si‐CCAT1. After treatments for 48 hours, the cell proliferation was determined using flow cytometry after the EdU assay (C). CCAT1, colon cancer‐associated transcript‐1; EdU, 5‐ethynyl‐20‐deoxyuridine. **P < .01, compared with the control group; ## P < .01, compared with the group of TNF‐α + NC, # P < .05, compared with the group of TNF‐α + si‐CCAT1. 3‐MA, 3‐methyladenine. *P < .05, **P < .01