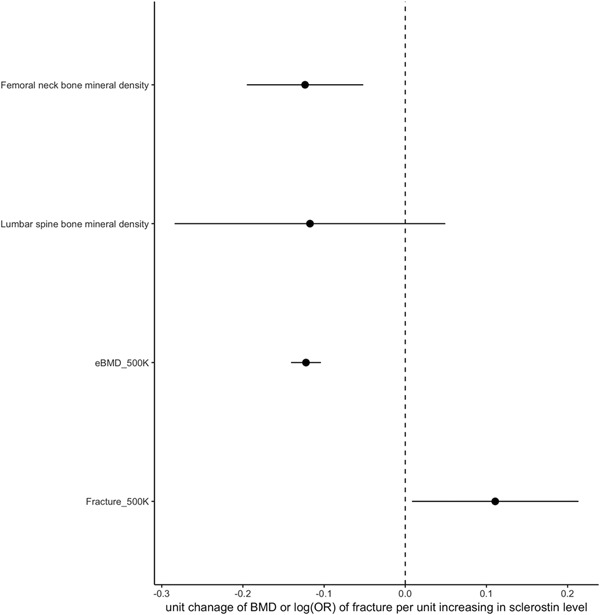
Figure 2.

Forest plot of putative causal relationship between serum sclerostin and bone phenotypes using Mendelian randomization. The x axis represents the causal estimates and 95% confidence intervals of SD change in BMD/eBMD and OR for fracture, per SD increase in sclerostin, as calculated by inverse variance‐weighted method. The y axis lists the four bone phenotypes used in the MR analysis.
