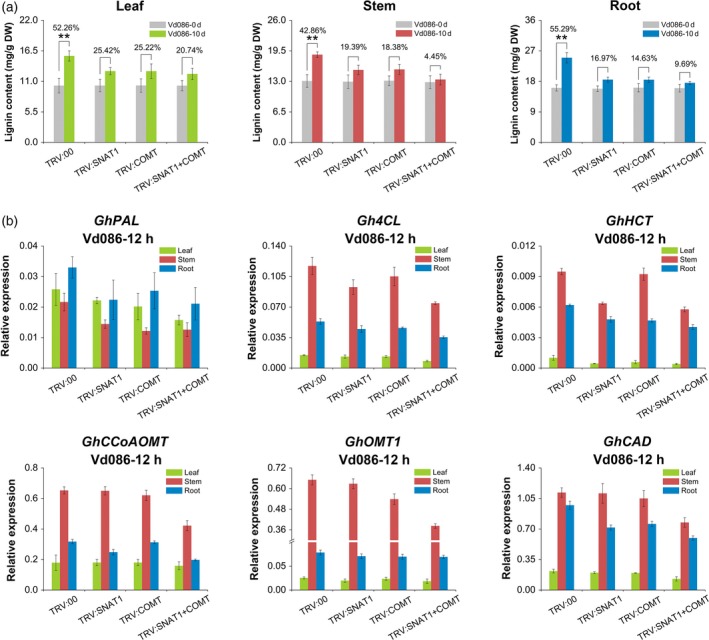
Figure 5.

Lignin content and expression levels of phenylpropanoid pathway genes in VIGS plants. (a) Melatonin‐induced changes in lignin content in different tissues of TRV:00, TRV:SNAT1, TRV:COMT, and TRV:SNAT1 + COMT inoculated with V. dahliae for 10 days. The values are the means ± SD; n = 3. (b) Melatonin‐induced changes in the expression levels of phenylpropanoid pathway genes in TRV:00, TRV:SNAT1, TRV:COMT, and TRV:SNAT1 + COMT at 12 dpi. The values are the means ± SD; n = 3. Statistical analyses were performed using Student's t‐test. *, P < 0.05; **, P < 0.01.
