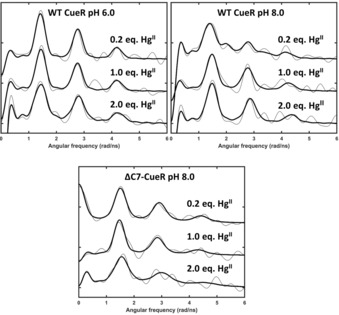
Figure 3.

Experimental (grey) and fitted (black) 199mHg PAC spectra of WT and truncated CueR in the presence of DNA with 0.2, 1.0 and 2.0 equivalents of HgII. Top left: WT at pH 6.0; top right: WT at pH 8.0 c WT CueR=12 μm, 0.5 equiv. DNA, and bottom: ΔC7‐CueR at pH 8.0 c ΔC7‐CueR=8.4 μm, 0.5 equiv. DNA.
