
Figure 4.
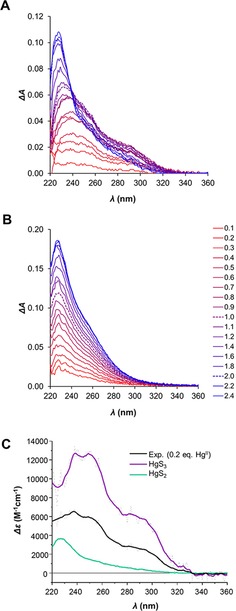
UV absorption difference spectra of WT CueR (A) and ΔC7‐CueR (B) titrated with HgII ions (0.1–2.4 equivalents). Spectra recorded in the presence of 1.0 and 2.0 equivalents of HgII are shown with dashed lines. pH 7.5, c WT CueR=14 μm, c ΔC7‐CueR=12 μm. (C) Estimated molar absorbance for the HgS2 and HgS3 species derived from the WT CueR UV absorption spectrum recorded with 2.0 equiv. HgII and 0.2 equiv. HgII combined with the relative population of the two species derived from 199mHg PAC data, see the text for details.