
Figure 2.
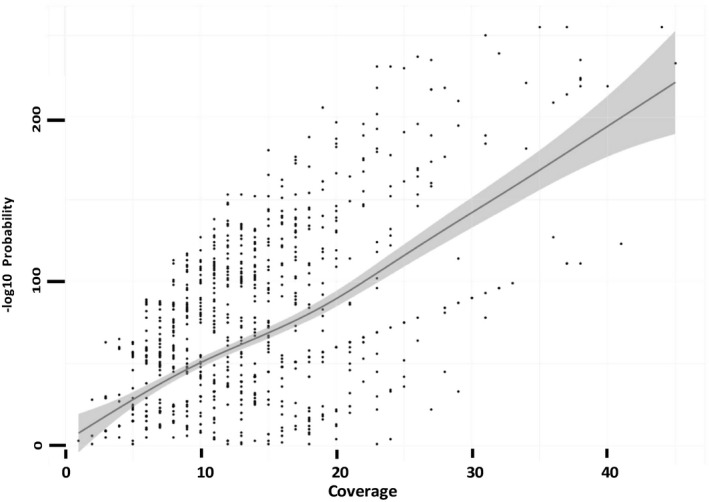
Plot of each genomic position by coverage (x‐axis) and −log10 of the likelihood of the second most likely genotype. The line represents the tendency of the distribution. The grey area represents the 95% confidence interval for the tendency calculated under the generalized addictive model.