
Figure 1.
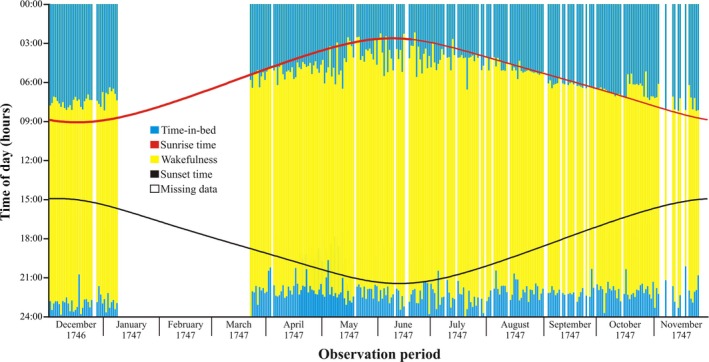
Daily bed and rise times of the researcher Olof Hiorter during the observation period December 1746 until November 1747 in Uppsala, Sweden. Data derived from Ekman (2018). Vertical bar charts represent the period of wakefulness (yellow) and time in bed (blue) for each day. The times of the first reading and the last reading of the magnetic needle were used to estimate the time of rising and time of going to bed, respectively. No bars were created if bedtime, rise time or both were missing (blank). For example, no data were available for the period 08 January–21 March 1747. Data concerning sunrise (red) and sunset (black) times for Uppsala were derived from https://www.timeanddate.com/sun/sweden/uppsala (date of retrieval: 19 February 2019)