
Figure 4.
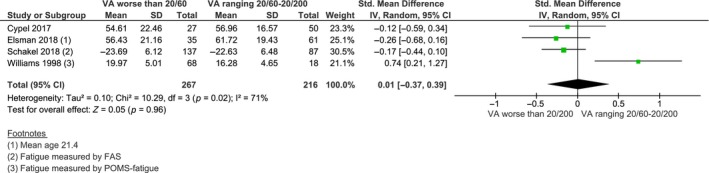
Forest plot of meta‐analysis: S.M.D. of fatigue severity between patients with moderate visual impairment and patients with severe visual impairment or blindness. S.M.D. standardised mean difference, S.D., standard deviation; CI, confidence interval; FAS, Fatigue Assessment Scale; POMS, Profile of Mood States; VA, visual acuity.