Figure 4.

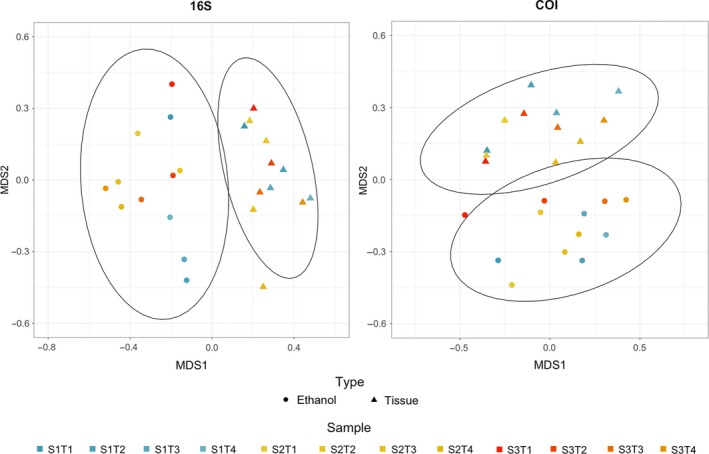
NMDS analysis of the recovered communities from ethanol and tissue for both 16S and COI markers, based on a Jaccard dissimilarity matrix [Colour figure can be viewed at http://wileyonlinelibrary.com]

NMDS analysis of the recovered communities from ethanol and tissue for both 16S and COI markers, based on a Jaccard dissimilarity matrix [Colour figure can be viewed at http://wileyonlinelibrary.com]