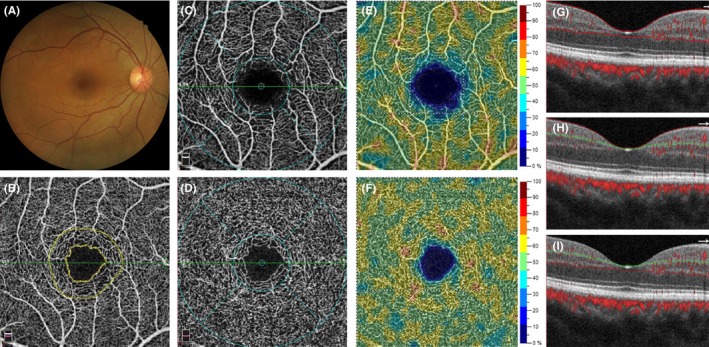
Figure 1.

A 49‐y‐old healthy woman in the control group. (A) Normal color fundus photograph. (B) An OCTA image of the inner retina, which contains of both the SVP and DVP. Inner yellow line demarcates the boundary of FAZ. The inner and outer yellow lines demarcate the 300‐μm‐wide region around the FAZ. (C) An OCTA image of the SVP. The blue colored grid is an ETDRS grid that contains the foveal region in a 1‐mm‐diameter circle and the parafoveal region within a 1‐mm‐wide circular annulus. (D) An OCTA image of DVP. (E) An vessel density map of SVP. (F) An vessel density map of DVP. (G) A B‐scan image shows the segmentation site at the inner retina (between the two red lines), located at the green line in (B). (H) A B‐scan image shows the segmentation site at SVP (between the red and green lines), located at the green line in (C). (I) A B‐scan image shows the segmentation site at DVP (between the green and red lines), located at the green line in (D)
