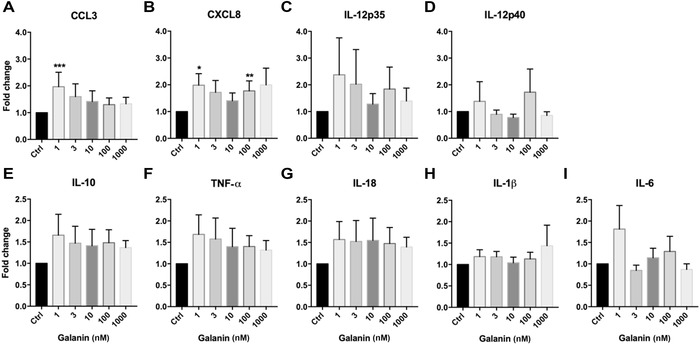
Figure 1.

Relative change of expression of (A) CCL3, (B) CXCL8, (C) IL‐12p35, (D) IL‐12p40, (E) IL‐10, (F) TNF‐α, (G) IL‐18, (H) IL‐1β, and (I) IL‐6 upon treatment of human monocytes with galanin, compared with vehicle‐treated cells. The numbers of independent experiments were: 1 nM (n = 14), 3 nM (n = 17), 10 nM (n = 18), 100 nM (n = 18), and 1000 nM (n = 18). Values are presented as mean ± SEM. *P < 0.05, **P < 0.01 indicate significant fold‐difference of mRNA expression compared with vehicle‐treated cells.
