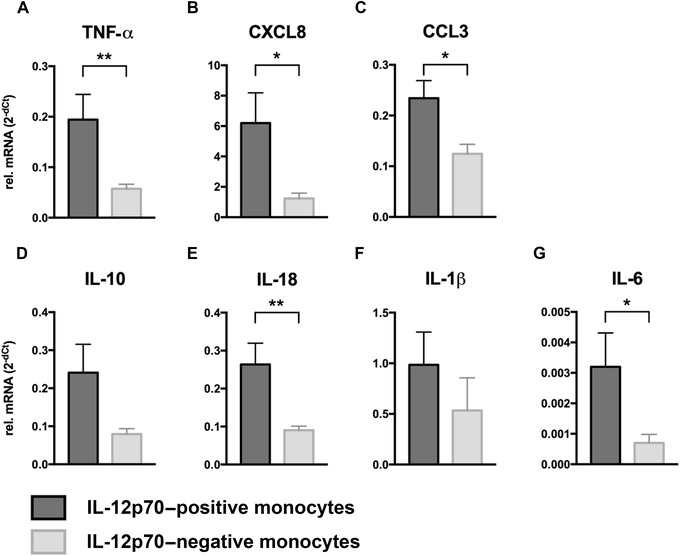
Figure 2.

Cytokine mRNA levels of IL‐12p70–positive monocytes (n = 19) and IL‐12p70–negative monocytes (n = 13). Expression levels of both groups were compared for (A) TNF‐α, (B) CXCL8, (C) CCL3, (D) IL‐10, (E) IL‐18, (F) IL‐1β, and (G) IL‐6. Values are presented as mean ± SEM. *P < 0.05, **P < 0.01 indicate significant fold‐difference of mRNA expression compared with vehicle‐treated cells.
