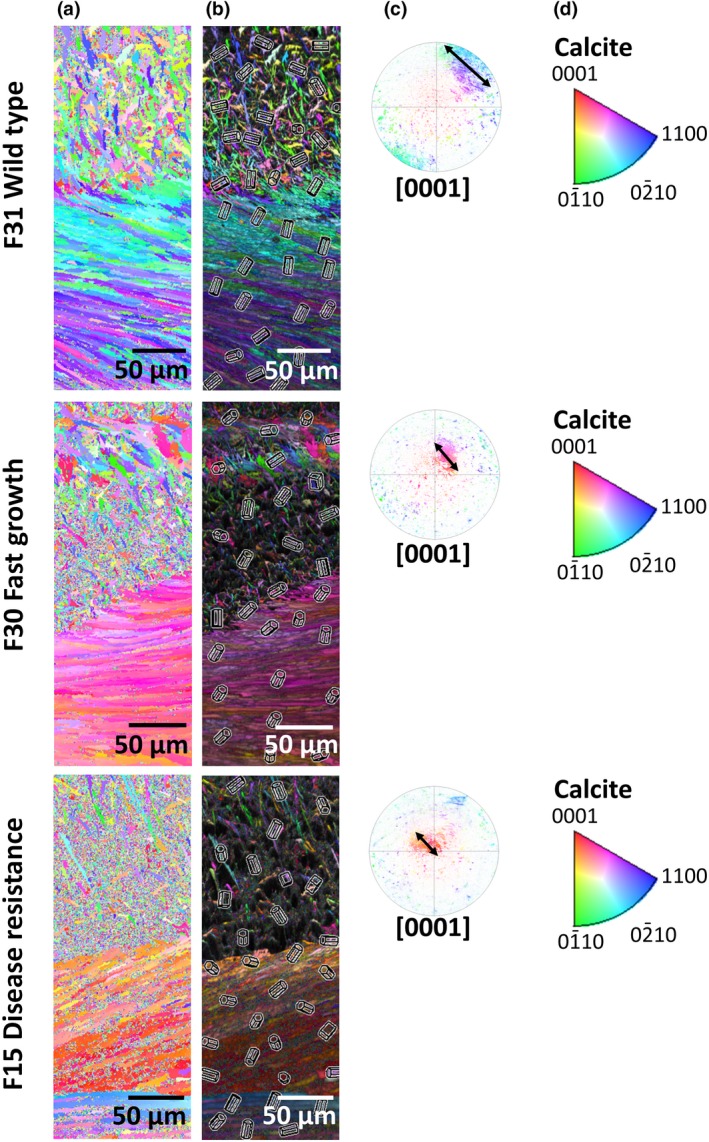
Figure 2.

Summary of the SEM–EBSD data for wild‐type (F31), fast growth (F30) and disease resistance (F15) oyster families. (a) Crystallographic orientation maps for each family according to the colour keys (d) for calcite [0001]. (b) Crystallographic orientation map overlaid on the image quality of the SEM crystal structure with crystal lattices indicating the direction of the orientation of the crystal highlighted. (c) Inverse pole figures with 90° gridlines showing the crystallographic orientation data as per images (a). For each family, the clustering of the data, highlighted by an arrow, indicates the spread of the crystallographic orientation data for calcite as per the colour keys (d)
