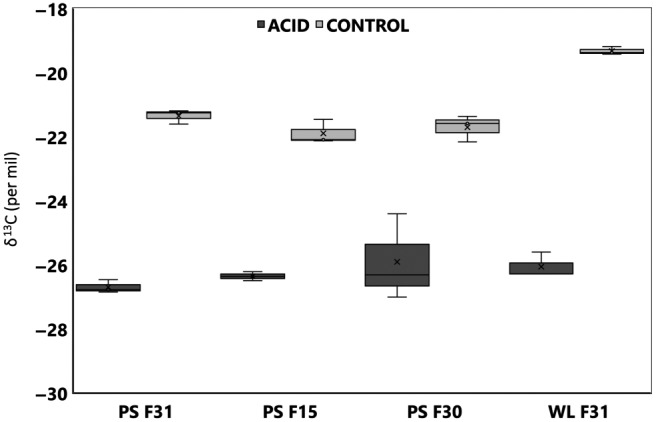
Figure 4.

Mantle tissue δ13C for wild‐type (F31), fast growth (F30) and disease resistance (F15) oyster families from control and acidified sites in Port Stephens (PS) and Wallis Lake (WL). Seawater δ13C is presented in comparison to the shell carbon for the control and acidified (acid) sites at PS and WL. All isotope analyses were done in triplicate and error bars represent the mean ± SD (N = 3)
