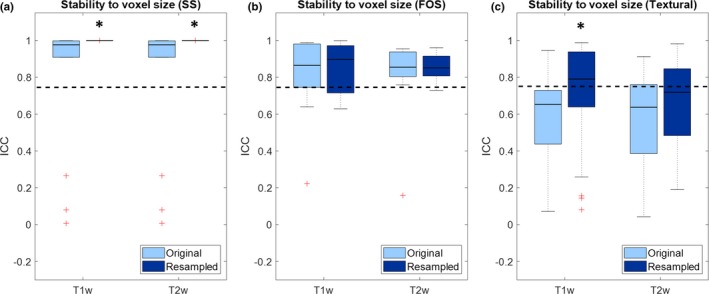
Figure 2.

Boxplot representing the intraclass correlation coefficient (ICC) of the radiomic features for stability to variations of voxel size: (a) shape and size; (b) first order statistics; (c) textural features. Significant increase in ICC due to preprocessing are reported with asterisks. The dashed line represents the threshold of stability (ICC = 0.75). [Color figure can be viewed at http://wileyonlinelibrary.com]
