
Figure 2.
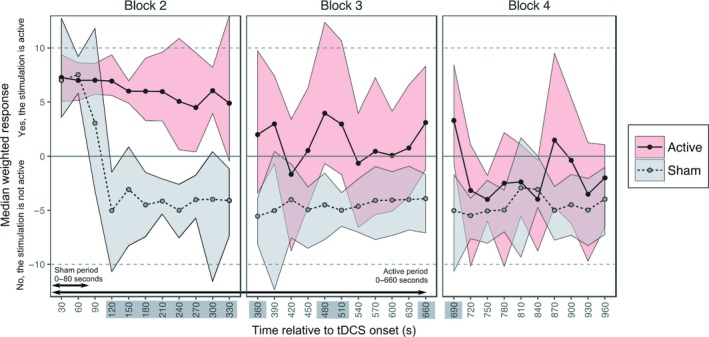
Sham‐blinding results. The median weighted responses are shown for active and sham, with bootstrapped 95% confidence intervals. Time points with distinct (i.e., non‐overlapping) ratings for active and sham are highlighted. [Colour figure can be viewed at http://wileyonlinelibrary.com]