
Figure 3.
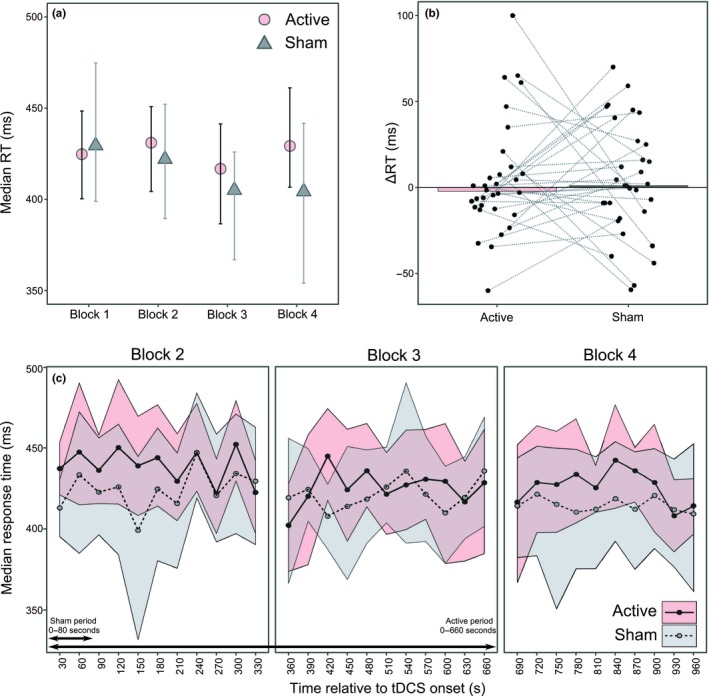
Reaction time results. (a) Median group‐level RTs per block with bootstrapped 95% CIs. (b) Median change in RT from baseline to Block 3 with individual participant medians shown. (c) Median RTs for each sub‐block of 10 trials with bootstrapped 95% CIs. [Colour figure can be viewed at http://wileyonlinelibrary.com]