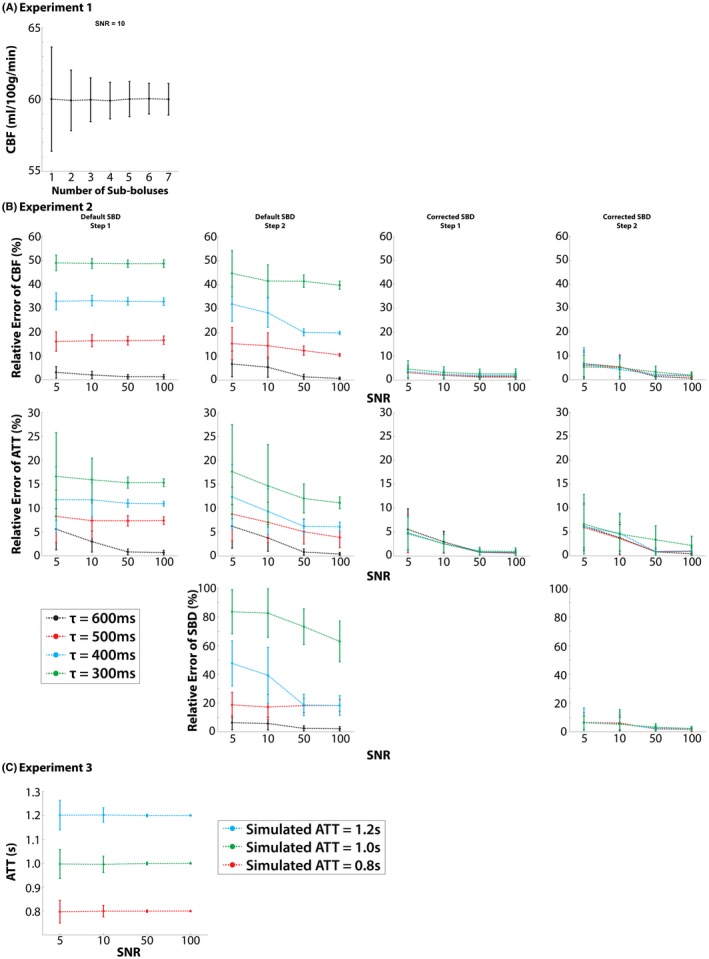
Figure 2.

Results of simulated experiments. (A) Experiment 1: estimated CBF values for the different number of sub‐boluses (simulated CBF = 60 mL/100 g/min). (B) Experiment 2: relative error between estimated and simulated values when the simulated SBD was varied. In default SBD, the errors were low only when the SBD was equal to the global value. In corrected SBD, the accuracy of the estimation was predominantly affected by the SNR. (C) The estimation of ATT was only affected by SNR
