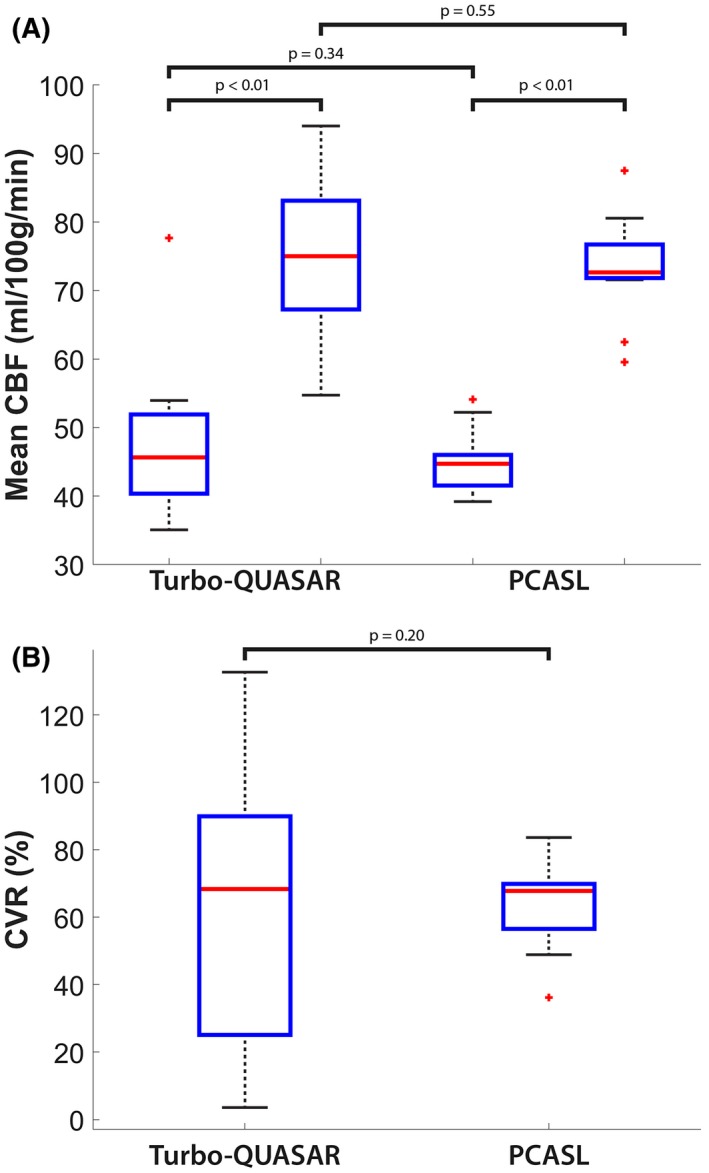
Figure 4.

(A) Mean CBF of all subjects before and after acetazolamide administration. For all methods, the CBF increased significantly after acetazolamide administration. (B) Mean CVR of the group. For both ASL techniques, the mean CVR values of the group were between 63% and 64% but not significantly different from each other. Each box plot indicates the median, 25th, and 75th percentiles, maximum and minimum not considering outliers, and the outliers represented by the “+” symbol
