Figure 5.

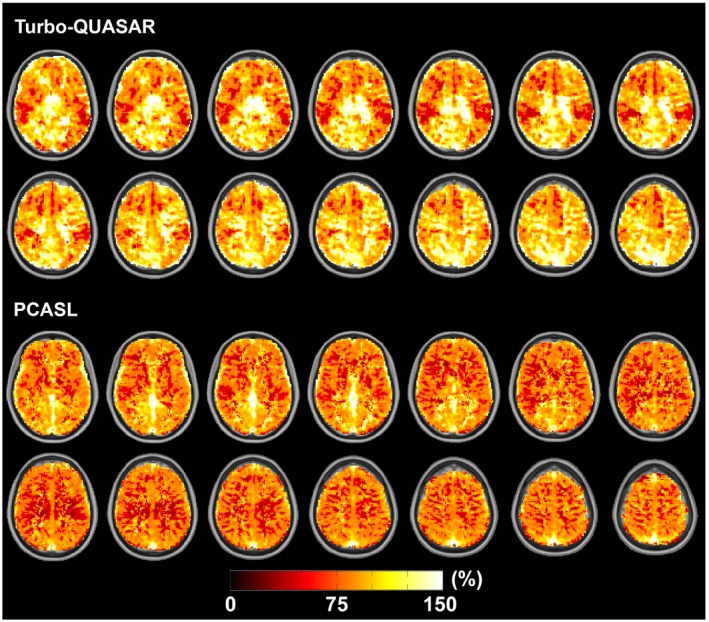
Estimated mean CVR map for each ASL method. In both Turbo‐QUASAR and PCASL results, the posterior region appeared to have the largest CVR. The views include transverse slices of z = 33, 35, …, 61

Estimated mean CVR map for each ASL method. In both Turbo‐QUASAR and PCASL results, the posterior region appeared to have the largest CVR. The views include transverse slices of z = 33, 35, …, 61