
Figure 5.
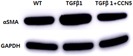
Intracellular protein analysis. Transforming growth factor‐β1 (TGF‐β1) stimulated α‐smooth muscle actin (αSMA) levels and CCN5 co‐treatment reduced αSMA levels. [Color figure can be viewed at wileyonlinelibrary.com].
Official websites use .gov
A
.gov website belongs to an official
government organization in the United States.
Secure .gov websites use HTTPS
A lock (
) or https:// means you've safely
connected to the .gov website. Share sensitive
information only on official, secure websites.
Intracellular protein analysis. Transforming growth factor‐β1 (TGF‐β1) stimulated α‐smooth muscle actin (αSMA) levels and CCN5 co‐treatment reduced αSMA levels. [Color figure can be viewed at wileyonlinelibrary.com].