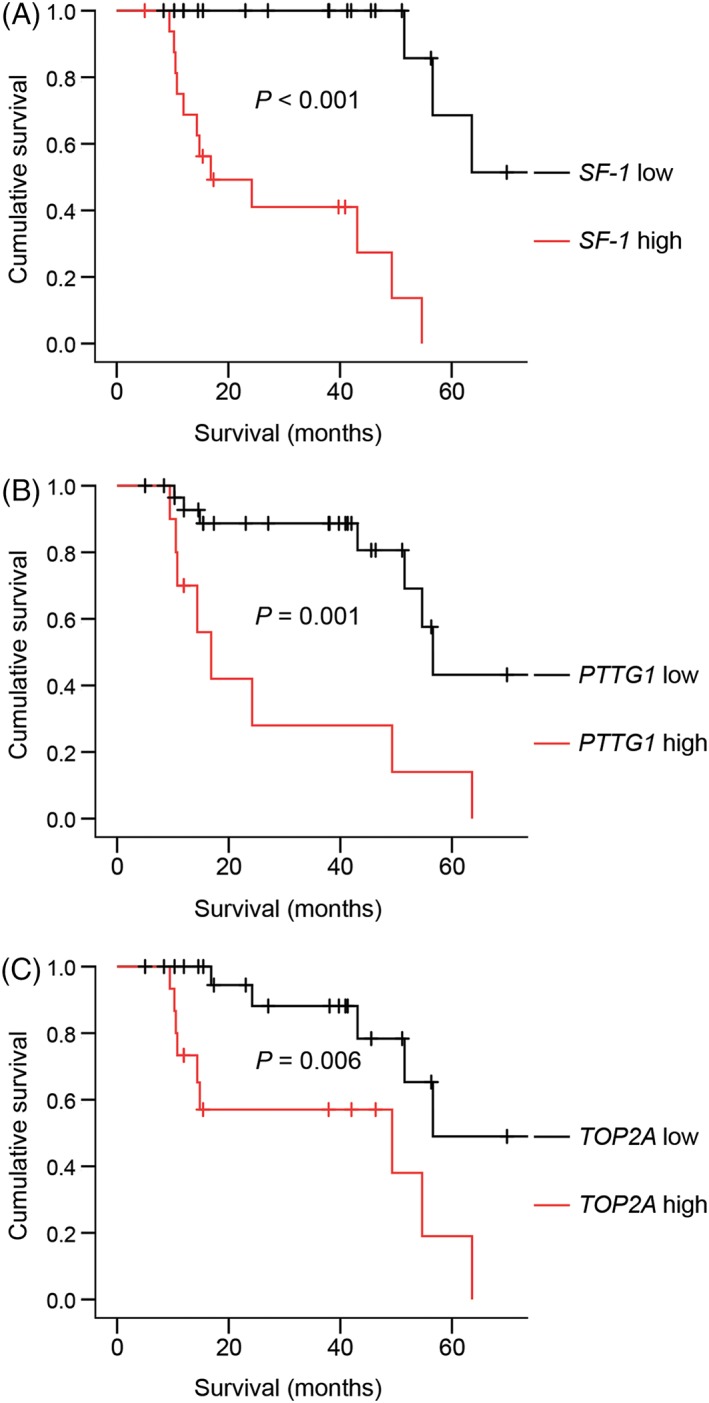
Figure 2.

Survival stratified according to SF‐1 (A), PTTG1 (B) and TOP2A (C) mRNA expression using Kaplan–Meier analyses. Dogs were classified as having (A) low (fold change <1.35, n = 23) or high (≥ 1.35, n = 17) SF‐1 expression; (B) low (<5.35, n = 30) or high (≥5.35, n = 10) PTTG1 expression and (C) low (< 6.31, n = 24) or high (≥6.31, n = 15) TOP2A expression. Tick marks indicate censored dogs. P‐values indicate the significance of the difference between the respective groups as calculated with the log‐rank test. PTTG1, pituitary tumour‐transforming gene‐1; TOP2A, topoisomerase II alpha [Colour figure can be viewed at http://wileyonlinelibrary.com]
