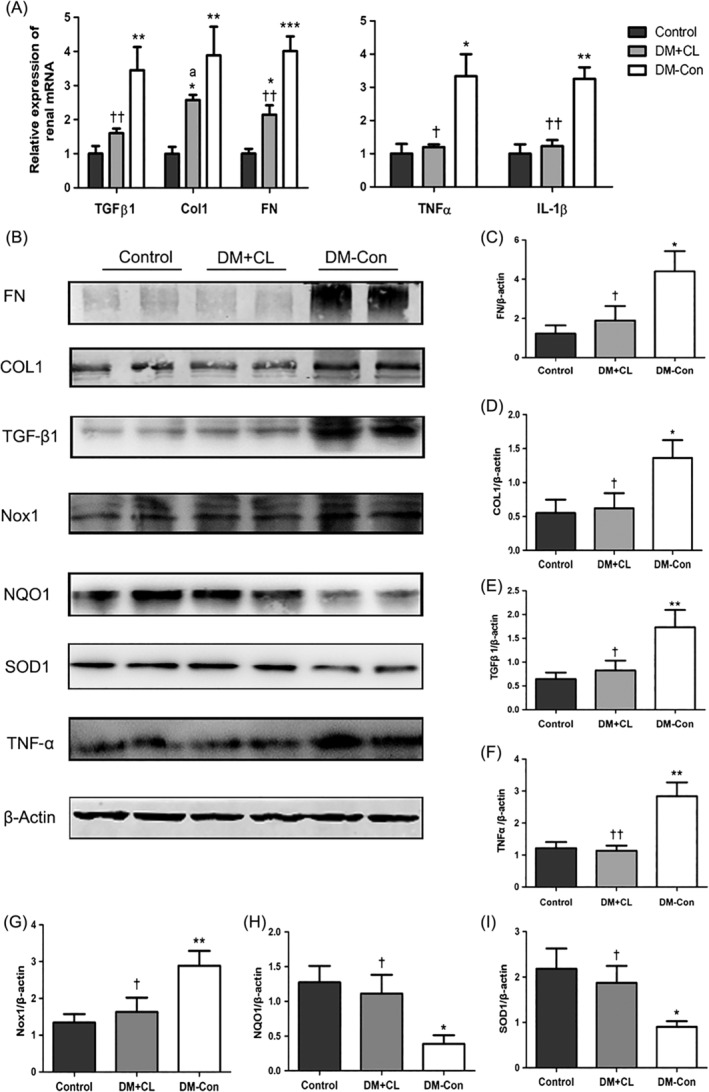
Figure 6.

Fibrosis, inflammation, and oxidative stress‐related molecules in the renal cortex of non‐diabetic (Control), streptozotocin‐induced diabetic (DM‐Con), and CL316,243‐treated diabetic (DM + CL) mice. A, Relative expression of the mRNA of renal fibrotic and inflammatory molecules. Tgf‐β1, transforming growth factor‐β1; Col1, collagen 1; Fn, fibronectin; Tnfα, tumor necrosis factor‐α; IL‐1β, interleukin‐1β. B, Representative western blot showing Fn, Col1, Tgf‐β1, Tnf‐α, NADPH oxidase 1 (Nox1), NAD(P)H dehydrogenase 1 (Nqo1), superoxide dismutase 1 (Sod1), and β‐actin. C‐I, Densitometric analysis of western blotting results. Data are the mean ± SEM (n = 6 per group). *P < 0.05, **P < 0.01, ***P < 0.001 compared with Control; † P < 0.05, †† P < 0.01 compared with the DM‐Con group. a P = 0.089 compared with the DM‐Con group
