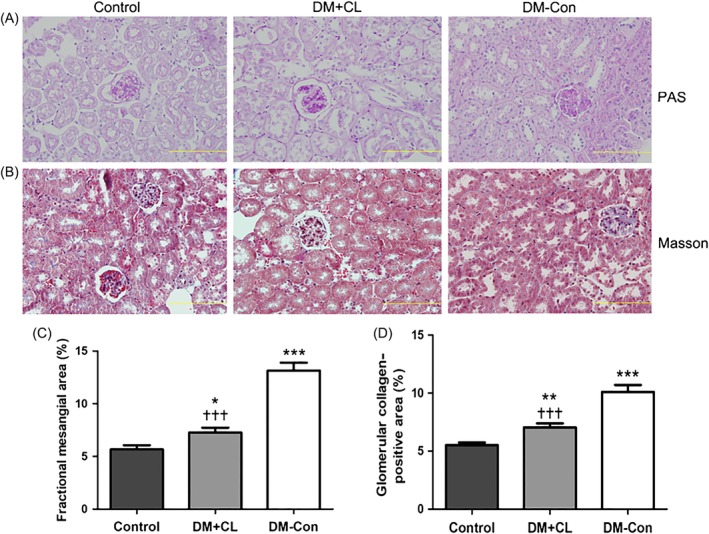
Figure 7.

Renal histological changes in non‐diabetic (Control), streptozotocin‐induced diabetic (DM‐Con), and CL316,243‐treated diabetic (DM + CL) mice. A,B, Representative images of periodic acid‐Schiff (PAS) and Masson's trichrome (Masson) staining of renal sections from Control, DM‐Con, and DM + CL mice. Bars, 10 μm. C, Mesangial expansion and D, collagen accumulation in PAS‐ and Masson‐stained slices, respectively, as quantified using Image‐Pro Plus 6.0 software (Media Cybernetics, Silver Springs, MD). Data are the mean ± SEM (n = 6 per group). *P < 0.05, **P < 0.01, ***P < 0.001 compared with Control; ††† P < 0.001 compared with the DM‐Con group
