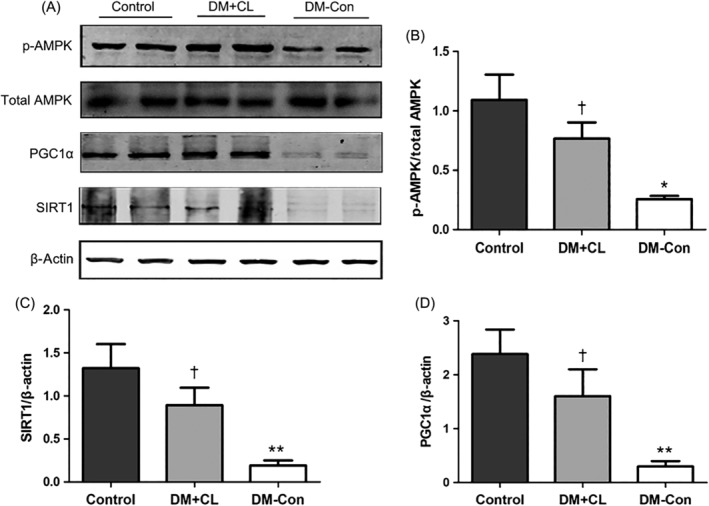
Figure 8.

Phosphorylated (p‐) AMP‐activated protein kinase (AMPK) (Thr172), total AMPK, sirtuin 1 (Sirt1) and peroxisome proliferator‐activated receptor‐γ coactivator‐1α (Pgc1α) levels in the renal cortex of non‐diabetic (Control), streptozotocin‐induced diabetic (DM‐Con), and CL316,243‐treated diabetic (DM + CL) mice. A, Representative western blots for p‐AMPK (Thr172), total AMPK, Sirt1, Pgc1α, and β‐actin in renal cortical tissues. B‐D, Densitometric analysis of western blotting results. Data are the mean ± SEM (n = 6 per group). *P < 0.05, **P < 0.01 compared with Control; † P < 0.05 compared with DM‐Con
