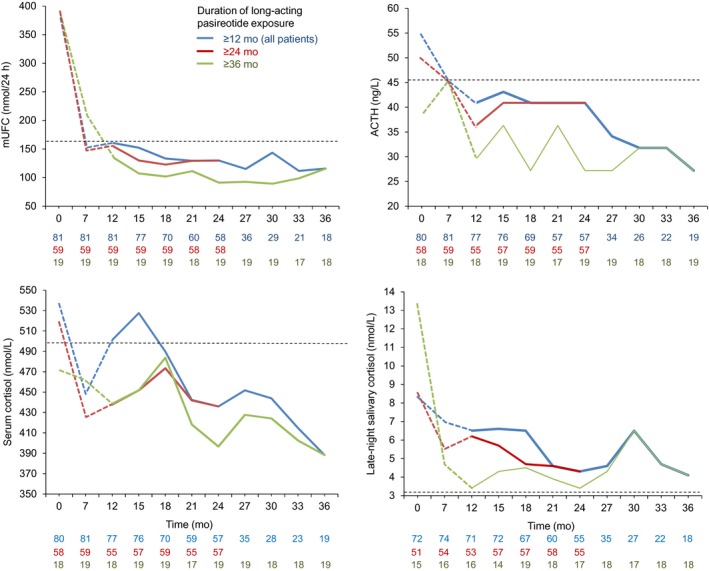
Figure 2.

Median mUFC, ACTH, serum cortisol and LNSC over time, by duration of pasireotide treatment. Continuous lines represent data collected during the extension; dashed lines represent data collected during the core study for patients who were later enrolled in the extension. Horizontal reference lines represent the ULN range for mUFC (166.5 nmol/24 h), morning plasma ACTH (45.4 ng/L), morning serum cortisol (532.2 nmol/L) and LNSC (3.2 nmol/L). The number of patients contributing to the median is displayed under the X axis
