
Figure 4.
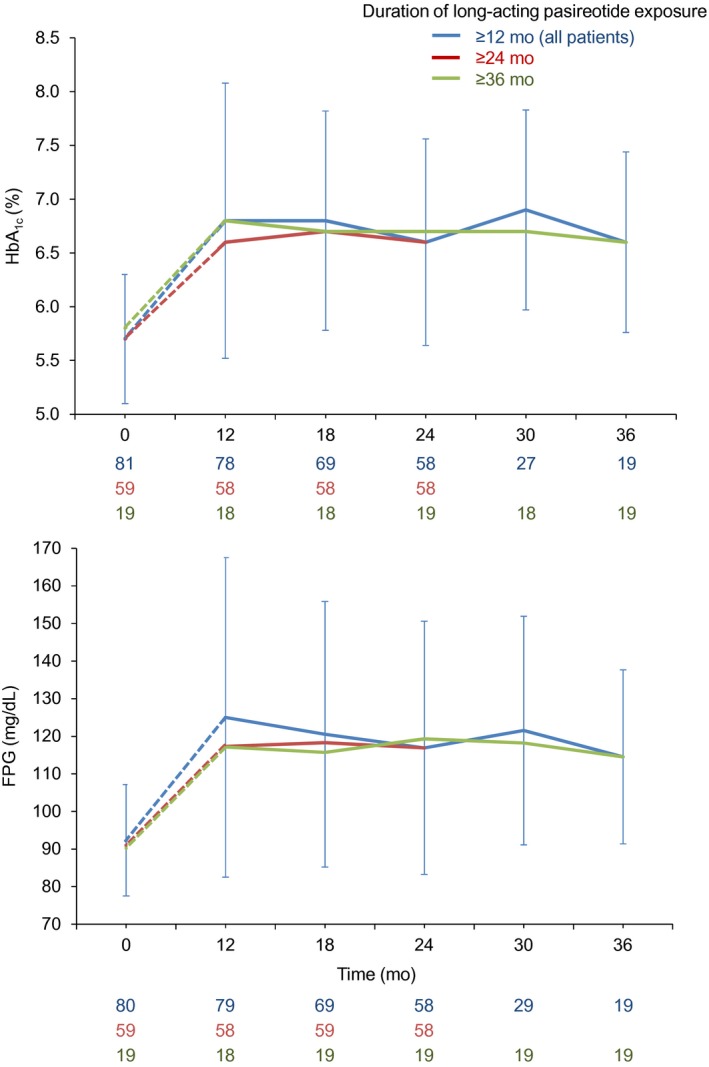
Mean (SD) FPG and HbA1c levels during the extension phase. Continuous lines represent data collected during the extension; dashed lines represent data collected during the core study for patients who were later enrolled in the extension
Official websites use .gov
A
.gov website belongs to an official
government organization in the United States.
Secure .gov websites use HTTPS
A lock (
) or https:// means you've safely
connected to the .gov website. Share sensitive
information only on official, secure websites.
Mean (SD) FPG and HbA1c levels during the extension phase. Continuous lines represent data collected during the extension; dashed lines represent data collected during the core study for patients who were later enrolled in the extension