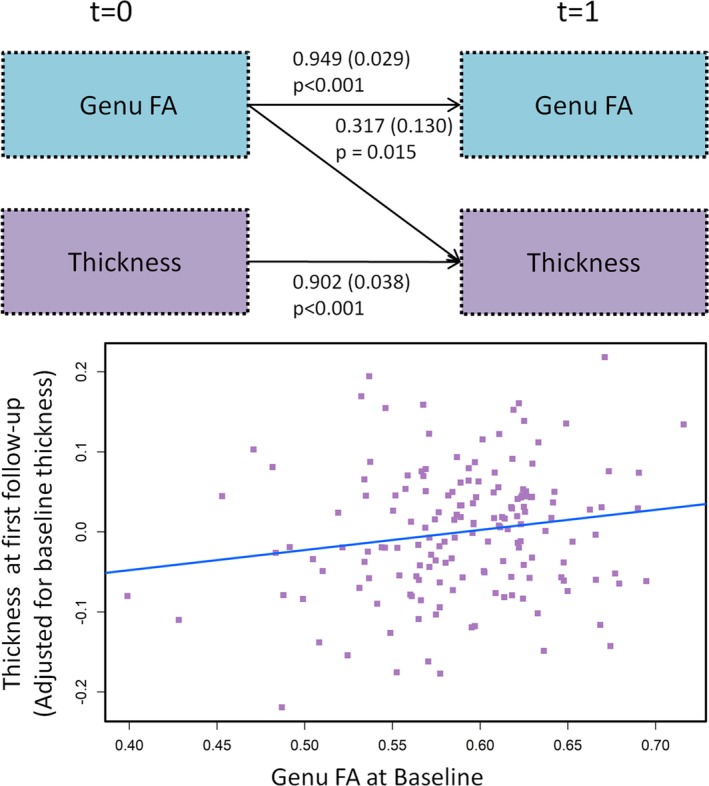
Figure 1.

(Top panel) Two‐panel model showing the impact of worsening white matter microstructural changes as measured by genu fractional anisotropy (FA) on future neurodegeneration. The values shown by the arrows indicating significance refer to the estimate, standard error in parentheses, and p value. (Bottom panel) Plot of baseline genu FA versus thickness at first follow‐up after adjusting for baseline thickness.
